A new release (V16.018 and UI+ V2.018) is available.
Upon completion of the installation of the current installer, you will find two applications in your SYNOPSYS™ folder and two shortcuts on your desktop. You can choose which one to use based on your own preference.
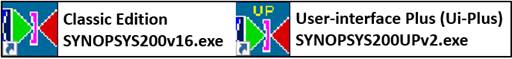
The Classic Edition (V16.018) provides you access to the powerful and long trusted SYNOPSYS™ Lens Design Software. In the Ui-Plus Edition (V2.018), we integrate all the features of the Classic Edition and wrap around it with an enhanced, streamlined, and workflow-oriented User Interface with the goals to allow new users to kickstart their designs with ease.
Change to Installer:
We have included the ‘Microsoft Visual C++ Runtime Library Redistributable′ in this Installer because some users reported failure in launching SYNOPSYS™ after some Windows update. You will be prompted to accept the redistributable package when you install. If you don’t have problem running SYNOPSYS™, it would be fine not to install.
Technical Guide to High DPI (4K) Monitor:
We have prepared a Technical Document,′Using SYNOPSYS™ with large DPI displays′, to provide guidance on how to set SYNOPSYS™ adapt to the high DPI 4K monitors. You can also find the document in the Application Notes section of the Knowledge Base at our website.
New Features for both Classic and UI-Plus Editions:
- A new directive is available for ZSEARCH. The EFW directive will apply equal weights to all field points. (If they have different GIHT targets, those weights are by default adjusted so smaller fields will get higher weights.)
New Features for UI-Plus Edition only:
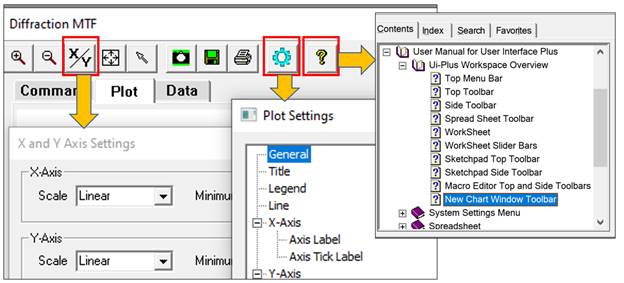
- New Chart Graphics Windows: In this release, we implemented new chart graphics windows for the diffraction and geometrical MTF analysis. More to come in the coming releases. The new chart graphics window includes the following features:
- Plot Setting Dialog allows user to set font sizes and colors to the axis labels and tick labels.
- X/Y Range Setting button to quickly select the desired display ranges; easily switch between log and linear scale display for data curves.
- New false color display of contour plot with thumbnail showing the selected area when zoom in.
- Built in Data Tab to the Graphics Windows; you can easily copy and paste the data into an Excel data sheet or export the data as .csv files.
You can click at the Help button in the Graphics Window to learn more about this:
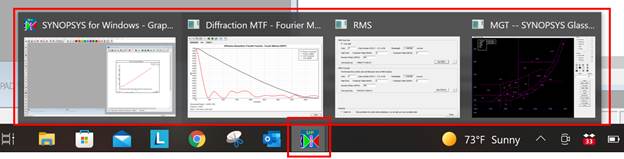
- Stacking icons at Taskbar for easy access of minimized dialogs and graphics windows. You can hover over the icons to view and select which window to restore.
- Improvements to Macro Editor:a. New
- keyword mapping and color scanning mechanisms to make it easier to scroll through a long macro.
- New arrangement of Macro Editor Toolbar buttons. You can learn more about this by clicking on the Help button in the Macro Editor.
Bugs Fixed for both Classic and UI-Plus Editions:
- The plot created by the glass table showing P* vs. P** was positioned wrong.
- The link to the Sumita glass table from the SPS display did not work.
- DMASK did not work if the DOE was made from an IR material.
- The ZSEARCH features USE CURRENT and AFOCAL did not work properly.
Click this link to learn more about the Ui-Plus Edition:
https://osdoptics.com/wp-content/uploads/2021/04/UI.mp4
Click this link for a new video from Don on Free Form Build, a powerful platform to build off-axis freeform mirror systems:
https://osdoptics.com/wp-content/uploads/2021/07/FFBUILD.mp4